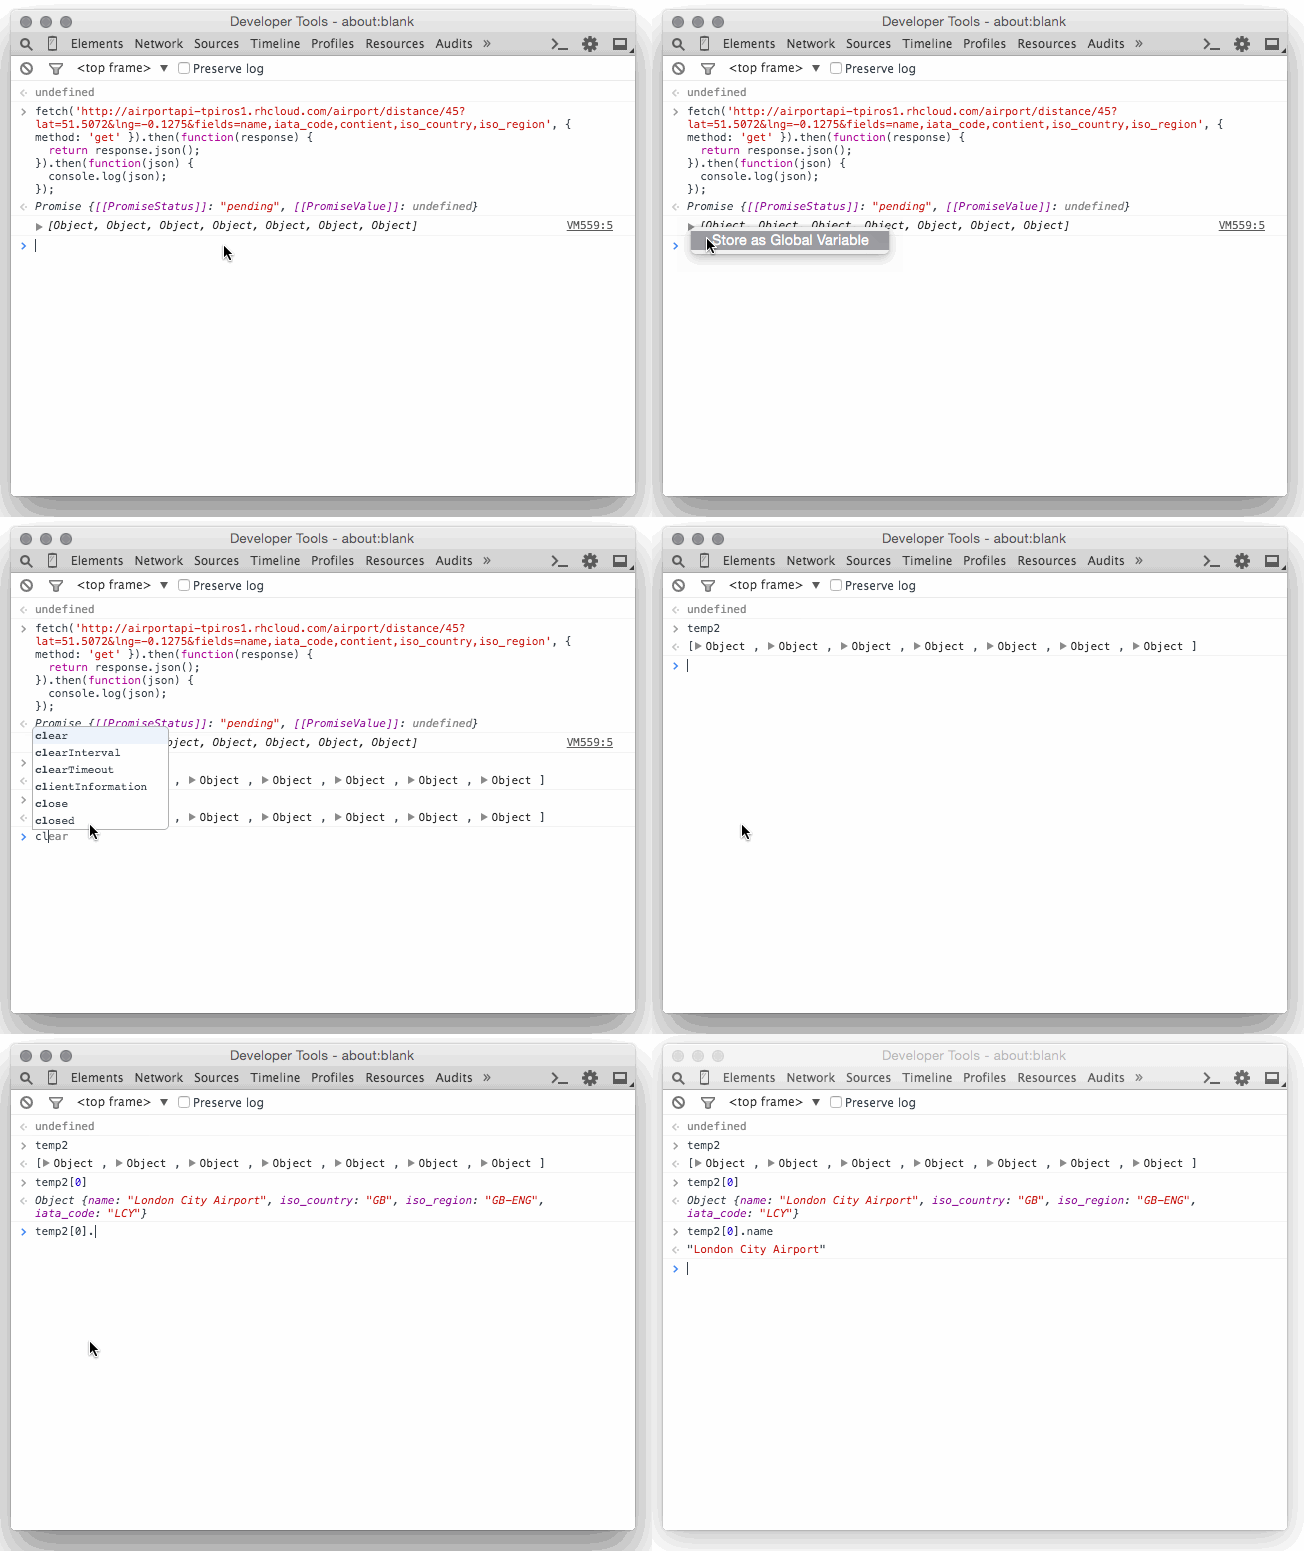
Google Chrome is the browser that I use for everyday browsing as well as development and it's jam packed with features that help developers with debugging their code. There are some obvious features such as the Console or the network tab.
In this short article I'd like to present you with a relatively unknown feature of the Console in Chrome's Developer Tools.
Let's assume that you have a piece of code that retrieves information from a webservice - say - using the Fetch API. (Available in Chrome & Firefox the Fetch API is a replacement technology for XMLHttpRequest and it uses Promises as well)
fetch('http://airportapi-tpiros1.rhcloud.com/airport/distance/45?lat=51.5072&lng=-0.1275&fields=name,iata_code,contient,iso_country,iso_region', { method: 'get' }).then(function(response) {
  return response.json();
}).then(function(json) {
  console.log(json);
});
During development we all write code such as the one above logging something out to the browser's console. Wouldn't it be great if we could put the result of log statement into a temporary variable and access that later on? This is possible using Dev Tools today - simply right click on the object and select the 'Store as Global Variable' option which is going to create a variable tempX where X is going to be an integer (temp1, temp2 so on and so forth)
